|
Hypothesis testing is an interesting subject. I can’t say that as a test engineer I use hypothesis testing on a regular basis, but it’s a useful thing to know a little bit about. The basic concept is that you have an idea of something being true (a hypothesis) and hypothesis testing coupled with a statistical method to analyze data is used in order to determine if your idea is true. For example, let’s say that under ideal conditions a voltage measurement will always measure 5 volts. Now, I want to know if I make the same measurement in a high humidity environment, will that significantly affect the measurement average. This becomes the null hypothesis and the alternate hypothesis. The null hypothesis is denoted by Ho and in this example is that the voltage measurement in high humidity is equal to 5 volts. The alternate hypothesis is denoted by H1 and is that the measurement under high humidity is not equal to 5 volts. It’s always confusing to me what is supposed to be the null hypothesis. The rule is that the null hypothesis is always assumed to be true. This is confusing because it depends on how you phase the null hypothesis, but here we are interested in a factor (humidity) altering the desired state of measuring 5 volts accurately. It doesn’t really matter what we think is going on. We might think that the humidity does have an effect, but until we can prove it (prove the alternate hypothesis is true) we assume the null hypothesis is true and everything is normal – 5 volts is measured accurately. I kind of think of it as the least interesting or default condition is always the null hypothesis. Example At this point it is easier to just turn the voltage measurement discussion above into an example. I used Labview to generate 100 random numbers to serve as the 5 volt measurements. I intentionally made the data skew slightly above 5 volts. I’m going to use the 1 sample T test in Minitab statistical software to perform the hypothesis testing. I should say that this is kind of trivial example, the real power is when you start using analysis of variance (ANOVA) to look at how multiple factors at multiple levels affect a process. The analysis was performed six times, each time reducing the number of samples that was used. Reducing the samples will illustrate how the decision to reject or fail to reject the null hypothesis becomes less certain. Figure 1 shows a partial screen shot of the data in Minitab. The columns are labeled with the number of samples in that column. 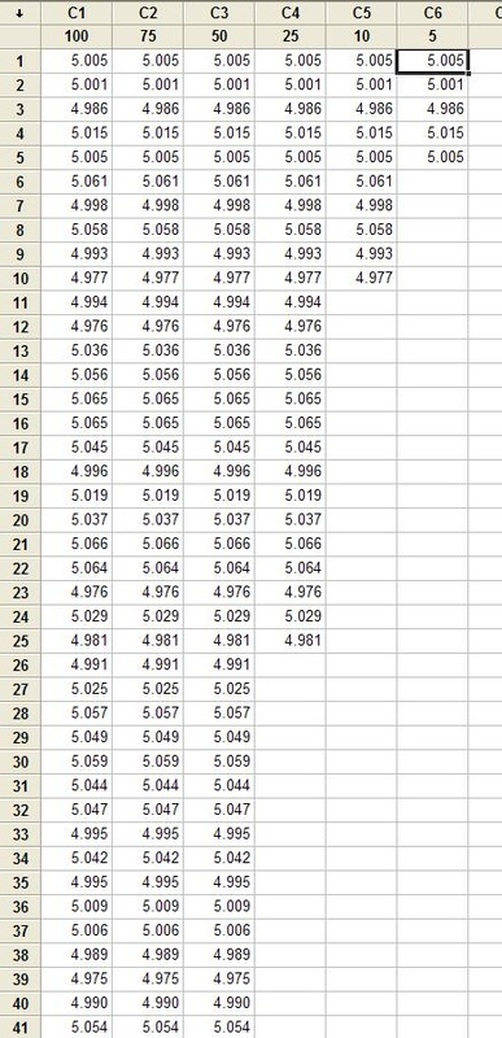 Figure 1. Partial screen shot of measurement data of different sample sizes Figure 2 shows the output of the T test from Minitab. 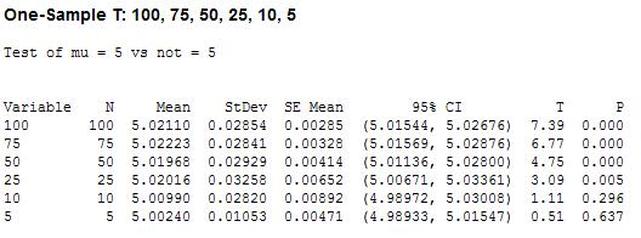 Figure 2. Results for 1 sample T test in Mintab of various sample sizes
In Figure 2 we can see that the column “N” is the number of samples. It shows that mean generally gets closer to 5 with fewer samples. The interesting result here is the P value in the last column. The results are not interpreted by the tool for us, but the rule is that since we are using a 95% confidence interval, any P value less than 0.05 would indicated that we should reject the null hypothesis. So, what’s all that mean? The P value is a probability value that tells us the probability that the null hypothesis is true. For N = 100, 75 and 50 it is saying that there is basically no possibility that the null hypothesis is true and we should reject the null hypothesis in favor of the alternate (and thus the humidity is having an effect). When N = 25 the P value is 0.005, which is still smaller than 0.05 and so we should still reject Ho. For N = 10 and 5 the sample size has gotten small enough that it’s now getting more likely that the mean is in fact 5 V, and we should fail to reject the null hypothesis. Figure 2 shows that we are using a default 95% confidence interval, that’s where the P value cut-off of 0.05 comes from (1 – 0.95 = 0.05). For N = 100, 75, 50 and 25 we are better than 95% confident that the mean is not 5V. You may be wondering why we would do all this. Why not just take a bunch of measurements and calculate the mean? That’s obviously important, but we can always argue that if we take way more measurements (samples) on top the current amount, then the mean will change. That’s why we use this tool, based on the number of samples, we can establish to with some level of confidence weather or not the mean is what we think it is. The results show that we get more and more confident as to the result as we add more samples. Hypothesis testing is also used by manufacturing and quality engineers where you have to sample a value from a process or a production line to try to figure out if the process is at the nominal value or drifting. Summary Hypothesis testing is a useful statistical concept for a test engineer to know and used by a lot of other technical people as well. This was a pretty simple explanation, but hopefully helpful. The steps in hypothesis testing are. 1. Determine your null hypothesis 2. Gather data 3. Assume the null hypothesis is true 4. Determine how much different you sampled values are different from your null hypothesis 5. Evaluate the P value P < 0.05 reject and P > 0.05 fail to reject. The mnemonic device is “If P is low, Ho must go”
2 Comments
A statistical concept that comes up often for me as a test engineer is the process capability index. This is a statistical concept that comes from statistical process control and is used on a process that is in control. I don’t really do anything with process control or control charts, but the process capability index is still a useful tool when you are developing tests and need to quickly evaluating a measurement and the feasibility of test limits being applied to it. Cpk When applying test limits to a measurement a design engineer (or someone with more knowledge of the circuit in question) may have an idea of what those limits should be, or they may just be offering a suggestion, making an approximate estimate. In this case, it may be wise to establish a temporary limit to be evaluated when more measurement data is available. Once a good sampling of the measurement data is available the limits can be evaluated to determine if they are going to be capable or if the measurement population is going to be coming very close to the specification limit when the measurement is taken a higher volume in production. Using the process capability index gives a hard number to tell you if you are right up against the specification limit and are going to risk a big fall out if the process shifts. One such process capability index is the Cpk statistic. Here is the formula for Cpk. 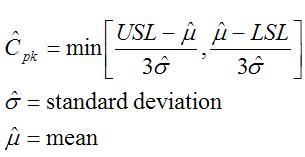 The little hats just mean that these are estimates. Figure 1 shows a plot of 20 measurements of a 5 V power supply (I just made these numbers up for illustration) 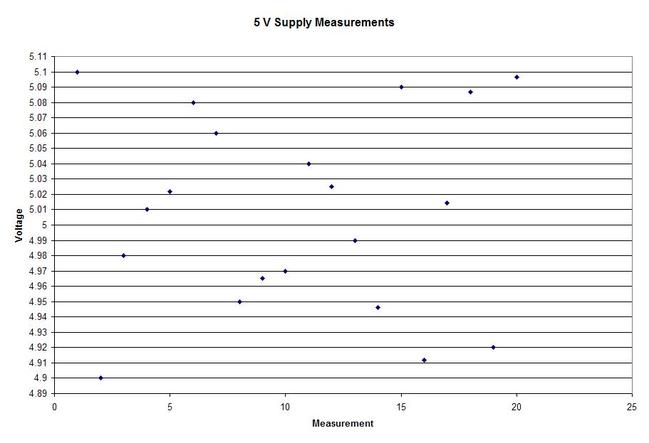 Figure 1. Measurement of a 5 V power supply repeated 20 times. Let’s say that we are measuring a 5 V power supply with an upper and lower specification limit (USL, LSL) set at 1%, 5.05 and 4.95 V. Figure 2 shows these limits marked on the plot. There is obviously some problem here as there are several failures. Calculating Cpk is not really necessary in this case but the result would be:  This is a bad result, any Cpk less than 1 is not good and ideally you want it to be over 2. 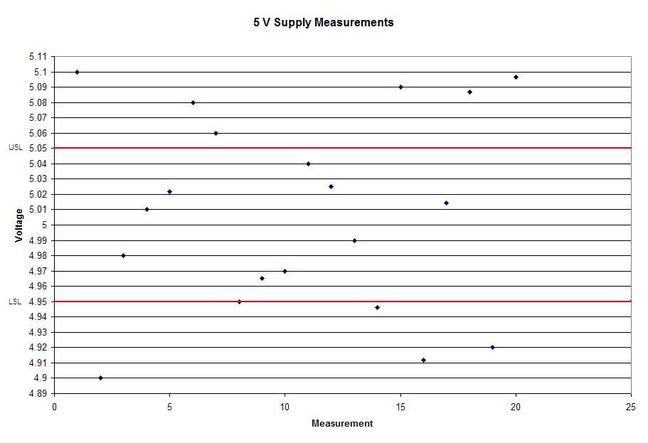 Figure 2. Measurement of 5 V power supply with 1% specification limits. Let’s try 10% limits of 4.5 and 5.5 V as shown in Figure 3. Now we get:  Cpk of 2.545 indicates that the limits are very good and the measurement population is not going to be close to either the low or high limit and is not close to having a lot of failures should the population shift. 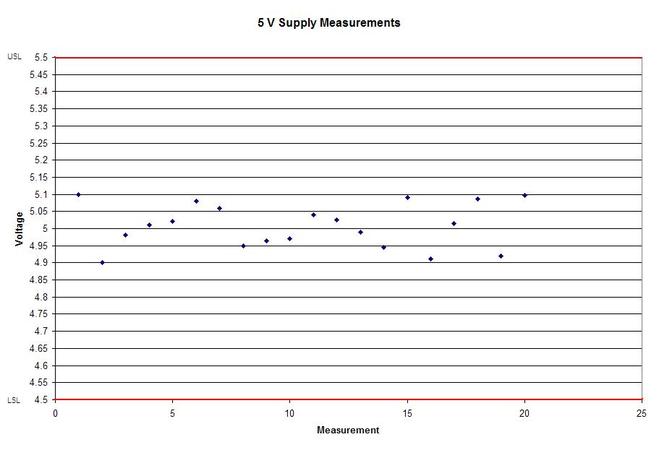 Figure 3. Measurement of 5 V power supply with 10% specification limits.
Now obviously Cpk is not the only factor in setting limits. You don’t just expand the limits if the Cpk is less than 2. The limits would ideally be calculated based on the component tolerances and using a monte carlo type analysis. However, the Cpk is useful in evaluating if a measurement is accurate and if it can be expected to have failures when under higher volume manufacturing. Summary The process capability index is a statistical concept taken from process control that is useful for test engineers to evaluate limits and measurement performance. Cpk is one method of calculating the process capability index. Cpk will help to evaluate how close a measurement population is to either the lower or upper limit. This is useful in predicting future test failures and determining if the measurement accuracy can or should be improved. |
Archives
December 2022
Categories
All

|
 RSS Feed