|
Having a good understanding of statistics is important for a test engineer. There is a lot that can be learned about your tests by examining the results. Some of the important tools are taken from the Six Sigma quality world, but there is so much going on there I could never cover it all. Also, many of the Six Sigma techniques are more focused on manufacturing and preventing waste (lean manufacturing) and achieving high yields. While these issues are of concern to a test engineer, you have to balance the desire for yield with the concern for quality. One statistical topic of particular importance is Gage Repeatability and Reproducibility studies. Also going by the name of Measurement System Analysis, performing a gage study is necessary to determine if and where any sources of variation in a test system are coming from. Sources of Variation There are three main sources of variation Operators When reading about gage R&R operators tend to be discussed as the actual people who are performing the measurements, but they can also be thought of as combination of equipment. If you wanted to look for variation problems with test fixtures or test systems, operators could be thought of as follows: Operator 1 = Test System 1 + Fixture 1 Operator 2 = Test System 1 + Fixture 2 Operator 3 = Test System 2 + Fixture 1 Operator 4 = Test System 2 + Fixture 2 When operators are people, comparing them allows you to identify poor training or a setup that is difficult to reproduce. Measurement System/Method What is being considered here, is the instrument taking a measurement or the test/measurement method. The word “gage,” is like a gage on a meter that shows a measurement, it’s just a substitute for instrument. Parts Ideally, parts should be the main source of variation reveled by the Gage study. When designing a gage study, ideally, all of the parts chosen should represent the entire population of parts by spanning the full range of tolerances. This is not always possible as the availability of parts may be limited or extremes in tolerance may not be available. This is important to see how the system performs on all of the parts that may have to measure. If an instrument or test system can accurately measure at the low range of the parts tolerance, but not towards the upper range that is a linearity problem. Operator by Part There is actually a fourth source, but it’s a combination of the others. Once operator and part variability have been considered, operators can be evaluated on a per part basis. This may reveal that on a particular part all of the operators are unable to measure it consistently. While this would also show up on the part variation, it is more difficult to tell in that case if the variation is a gage repeatability problem or an operator problem (due to that part). Other than part-to-part all of the sources of variation can be classified as problems due to repeatability or reproducibility. Repeatability Repeatability is defined as variation due to instrument error. Of the sources of variation listed above Measurement System/Method is assessed by examining the repeatability. What is done is a part is measured several times without changing any of the setup or operators. That data is then used to quantify the variation in a measurement system resulting from an instrument or test method. Reproducibility Reproducibility is defined as the variation due to external sources such as operators and environmental conditions. Of the sources of variation listed above Operators and Operators by Part are assessed by examining the reproducibility. Here, several operators will measure the same part repeatedly. This will reveal variability due to the operators. Example R&R Studies In order to show some of the features and problems that can be found, I’ll do an example of a simple R&R study and alter the data to show some features. Setup I’m going to measure ten 1k ohm resistors five times each, with two operators, and analyze the results with Minitab statistical software. In an ideal gage the parts should represent the complete population of parts, so if I use 1k 5% resistors I should have some in my experiment that measure at the tolerance extremes (950 ohm to 1050 ohm). Experiment 1: Measured Data The first experiment was to gather the data and analyze the results. I used two Fluke 189 DMMs to measure the resistance and act as the two operators. Figure 1 shows the data. 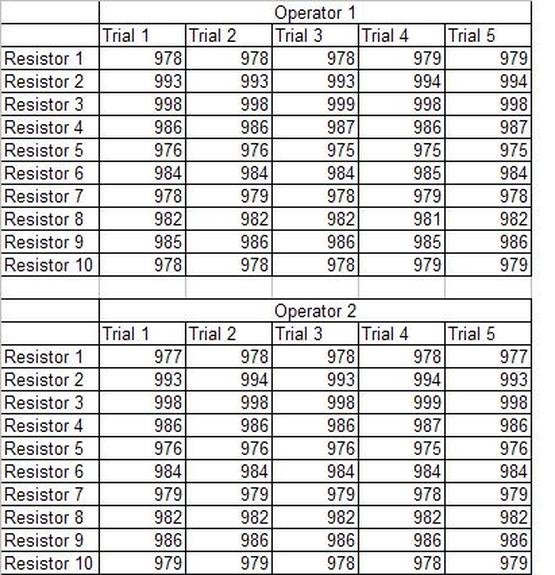 Figure 1. Original measured resistance data Figure 1 shows that I could not find a representative resistor population of the tolerance. As stated, the tolerance is 5% giving a range of resistances of 950 to 1050. However, none of the resistors in this population were even at 1k. This isn’t ideal but I wanted to use real data for the first experiment. Figure 2 shows the Minitab result of the crossed ANOVA gage study. 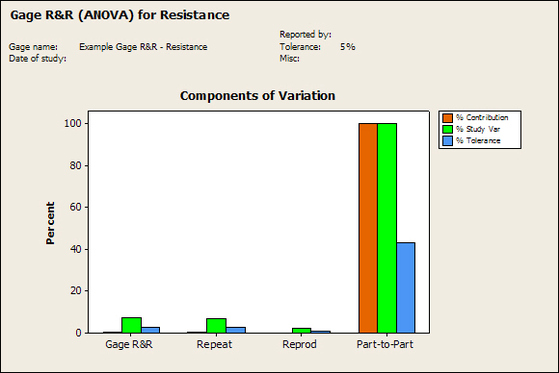 Figure 2. Gage R&R results. Figure 2 shows that the vast majority of the variation found was due to part to part variation. This is what we want to see when evaluating our test system. Figure 3 is another plot from this same experiment. It also shows the variation due to the parts with a connected box plot. 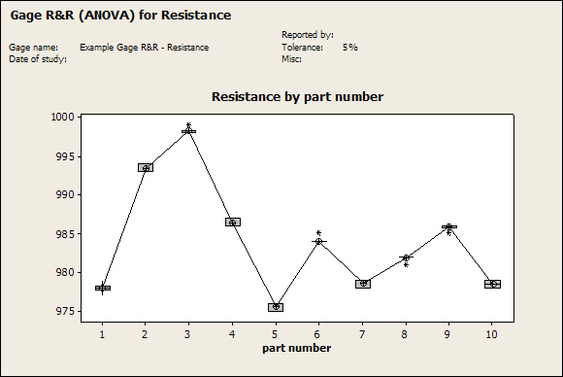 Figure 3. Connected box plot by part number. Figure 3 shows a connected box plot where a box plot shows the following. Outliers are shown as a star (*). The upper whisker extends to the maximum data point within 1.5 box heights from the top of the box. The box itself shows, the median, the first and third quartile. The first quartile shows where 25% of the data is less than or equal to the bottom line. The median is where 50% of the data are less than or equal to the center line. The third quartile is where 75% of the data are less than or equal to the top line. The lower whisker extends to 1.5 box heights below the bottom of the box. The connection line shows the averages. Figure 4 shows the connected box plot by operator. 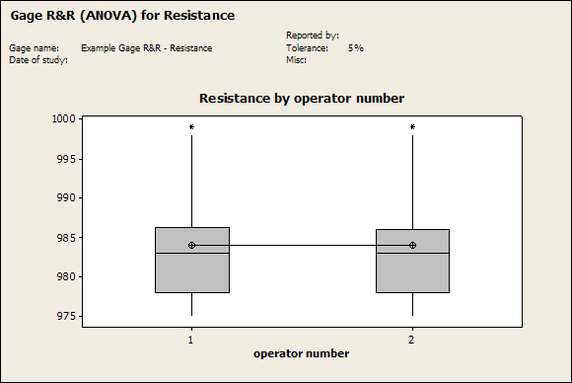 Figure 4. Connected box plot by operator number. In Figure 4 it you can see that it is showing an outlier on the high side. This is really illustrating the poor population I have for a 1k resistor since it is flagging a value below 1k as an outlier. We can also see that the reproducibility was very good from this plot, as both operators look about identical. Experiment 2: Problem with part 1 For this experiment I have altered the data for part 1 to make it look like it had some sort of repeatability issue. Figure 5 shows the new part 1 data. 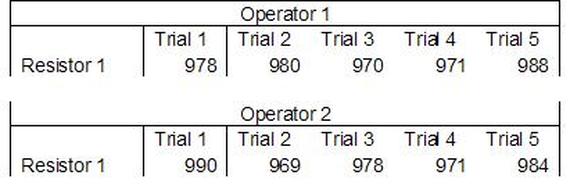 Figure 5. Altered part 1 data. Figure 6 shows the ANOVA gage study result with altered part 1 data. 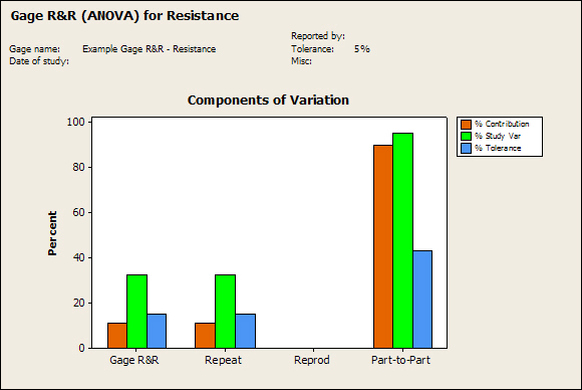 Figure 6. ANOVA gage study with altered part 1 data Figure 6 shows that there is now a more significant portion of variation due to repeatability, but we have to look at some of the other plots to understand what is really happening. Figure 7. shows the connected box plot by part number. 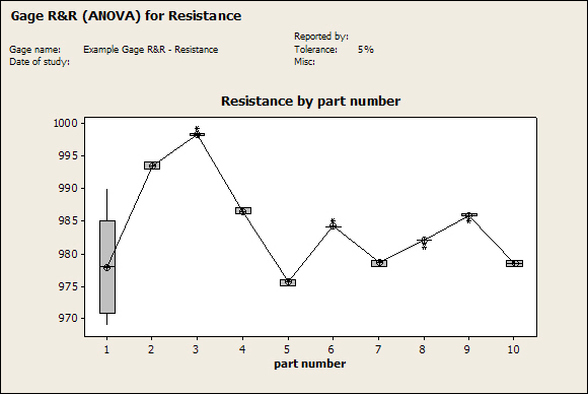 Figure 7. connected box plot by part number with altered part number 1 data So, now we can see from Figure 7 that there was something wrong with the repeatability of part 1. With this new data we can conclude that there is probably something going on with part 1 since it cannot be measured accurately repeatedly. We should also check that this problem was not due to just one of the operators and Figure 7 wouldn’t necessarily show this. Figure 8 shows the Xbar and R Chart for the experiment. 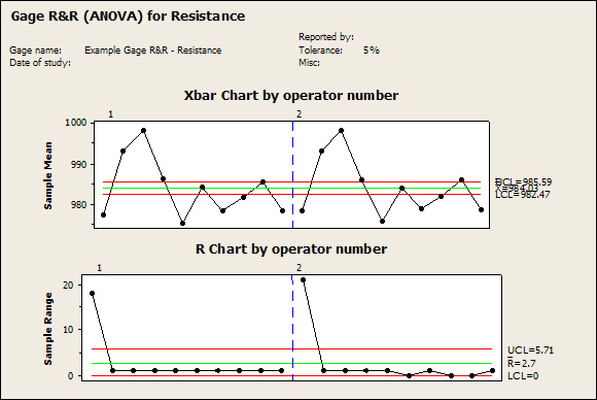 Figure 8 Xbar and R Chart with altered part number 1 data. Figure 8 shows us that both of the operators measured a large range of values (R Chart). This tells us that both of the operators had trouble measuring this part accurately. The Xbar chart shows the averages of all the parts by operator along with the grand average and upper and lower control limit line. The R (Range) chart shows the range of measurements made and plots them with the average range and control limits. We can see in Figure 8 that the range for part 1 on operator 2 was up over 20 ohms. Experiment 3: Repeatability Problems For this experiment I have altered all of the original data so that each measurement was offset by either plus or minus five ohms. Figure 9 shows the data set used. 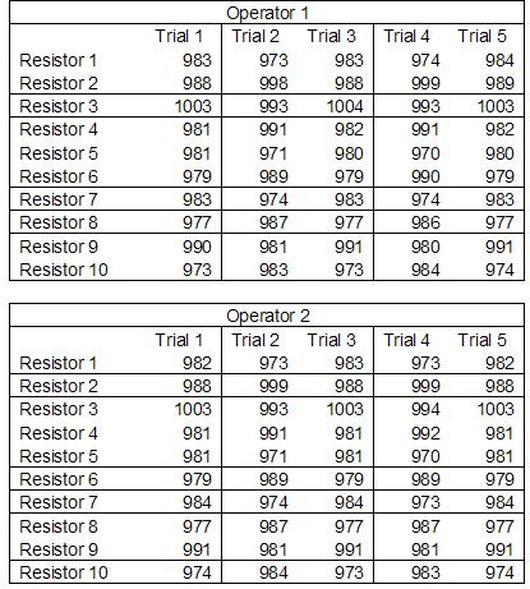 Figure 9. Resistance measurement data with added offset Figure 10 shows the ANOVA gage study result with offset data. 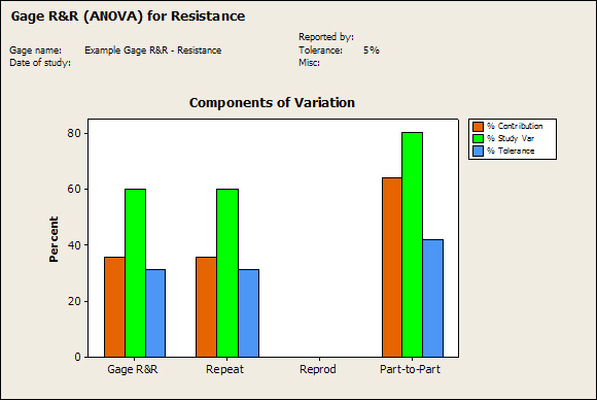 Figure 10. shows the ANOVA gage study result with offset added From Figure 10 it can be seen that the repeatability is a significant source of variation and may be a problem that needs investigating. This test system may not be making very accurate measurements. Figure 11 shows the resistance by part number. 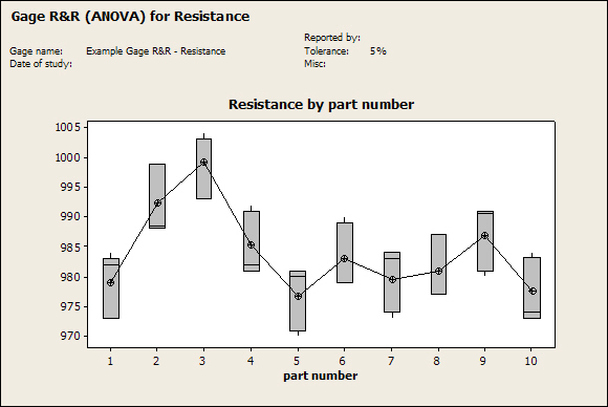 Figure 11 Resistance by part number for data with offset added. Figure 11 shows the large boxes in the box plot indicating a larger spread in the resistance measurements that is consistent for each part, indicating a repeatability problem. Experiment 4: Reproducibility Problem For this experiment the original data was again modified, this time an offset of plus eight ohms was added to all of the operator 2 data. Figure 12 shows the new data set. 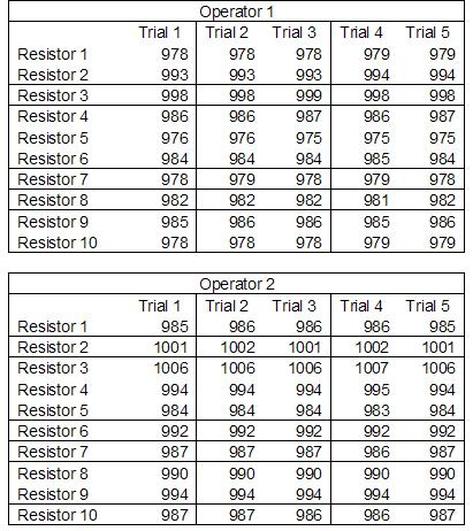 Figure 12. Resistance measurement data with +8 ohms on added to operator 2 Figure 13 shows the ANOVA gage study results. 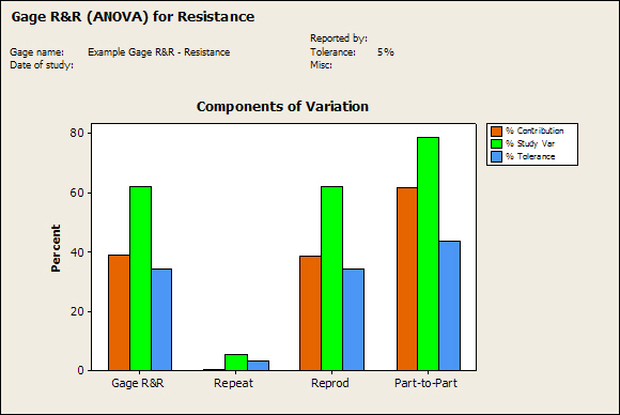 Figure 13. ANOVA gage study results with +8 ohms added to operator 2 From Figure 13 we can see that the reproducibility is now a significant portion of the variance and repeatability is back down. Figure 14 shows the resistance by operator number. 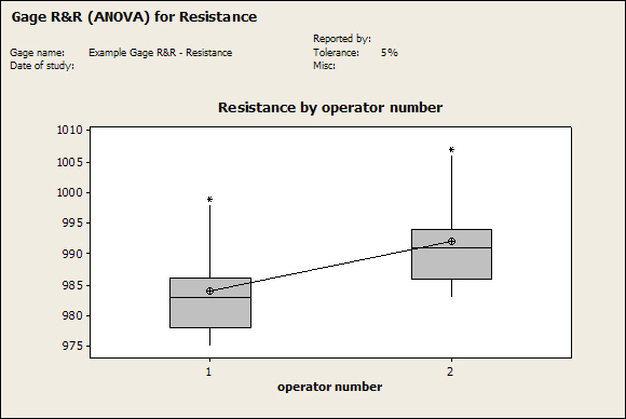 Figure 14. Resistance by operator number with +8 ohm offset added to operator 2 Figure 14 shows the 8 ohm shift nicely and would help to identify a reproducibility problem. Figure 15 shows the operator by part interaction. 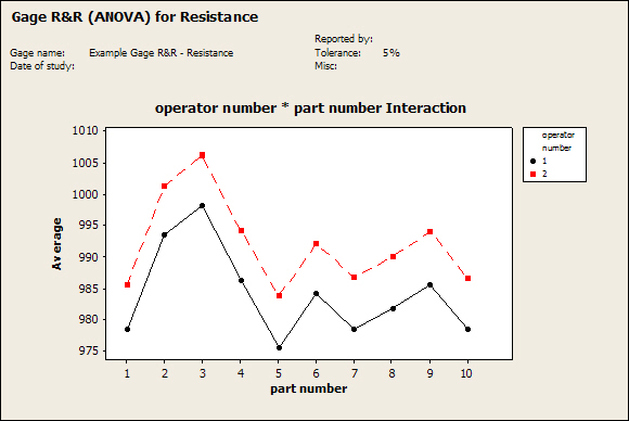 Figure 15. Operator by part interaction with +8 ohm offset added to operator 2
Figure 15 also shows that operator 2 consistently measures the resistances higher than operator 1, again showing reproducibility problems. Other Thoughts Using Minitab is nice for performing these studies because you get lots of plots in just a few clicks, but it is pretty formal and isn’t really necessary to learn about your test system. Just designing the study, taking the data and doing some quick plots in Excel is usually all you need to figure out what needs more investigation. Minitab also gives you a lot of quantitative data, like a p-value for each of the sources of variation. The idea with the p-value is you hypothesize that, for example, repeatability is not a significant source of variation and then the resulting p-value (low p = reject the hypothesis) tells you if that hypothesis is correct. This is probably more useful if you have to present your results in a formal way. Summary Performing a gage study can reveal a lot about your test system you will need to know before you can feel comfortable with the test results it is producing. The sources of variation are part-to-part, measurement system/method (repeatability) and operators (reproducibility). Often times you have to look at the same data presented in many different ways to see the patterns and get the full picture of the problems. While, gage studies reveal problems, that is just the start, it’s still up to you to go figure out what is causing the problem and how to correct it. |
Archives
December 2022
Categories
All

|
 RSS Feed