|
Recently I’ve been working with the Agilent U2001A power sensor. The U2001A is an averaging power sensor which simply means when the instrument is queried, that result is an average of multiple samples. If you want to easily measure peak power, you have to purchase the U2020 series power sensor, which costs more. However, the U2000A averaging sensor can be configured to create what is called a trace graph display, which effectively queries all of the individual points that go into the averaging the sensor is performing. Finally, software can be used to find the peak power measurement or simply display the measurement like a digitized waveform. To determine how to create the trace graph display I used the U2001A programming guide and the U2000 Series Labview driver from NI. The Agilent programming guide provides the example code, shown in Figure 1, to create a trace graph display. 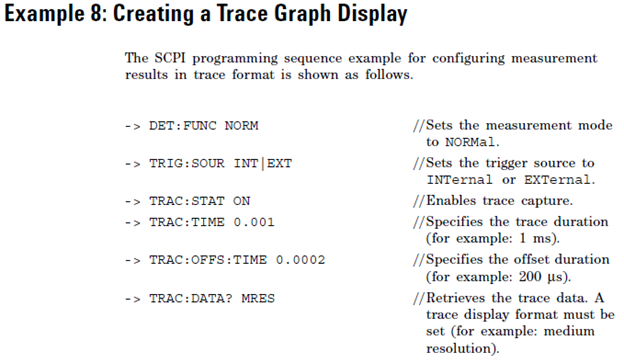 Figure 1. Example code for creating a trace graph display from the Agilent programming guide. This code is basically correct, but I feel like they left out a couple things. First of all I found that the trigger requires a little more explanation. The best way I found to do it was to trigger on a power level, their example doesn’t have this code. If you do not specify a trigger level it will just trigger immediate, but this doesn’t give as much control in some situations. Another thing I struggled with was how to decode the data returned by the instrument. The data is returned from the instrument in something called the IEEE 488.2 arbitrary block program data format. It took me a little while to find it, but the LabVIEW driver includes a VI to decode this data. I’m just pointing this out because the example from the programming guide doesn’t go into these details. Figures 2 and 3 show the LabVIEW code. The actual code is also available. 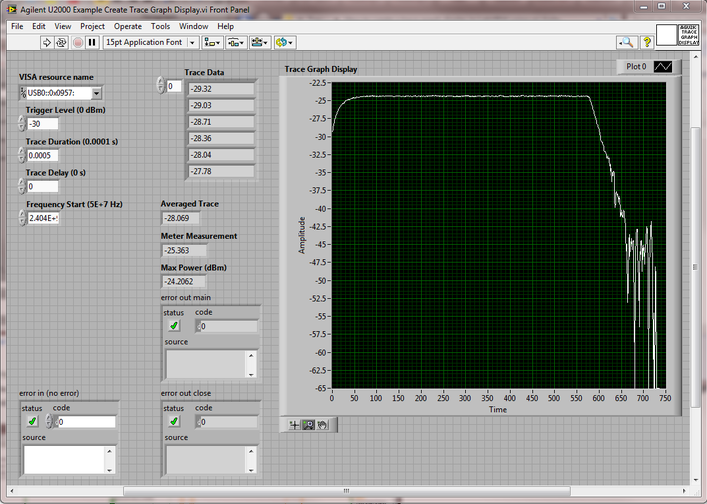 Figure 2. Front Panel of Example Create Trace Graph Display VI. A couple of things to note in Figure 2, the trigger level was set to -30 dBm. You can see from the graph that the acquisition begins at -30 on the rising edge of a pulse, there is a flat portion, and falls back into the noise. Also note the VI outputs: “Averaged Trace” is the average of everything on the graph, “Meter Measurement” is the average returned by the meter (I’m not totally sure why that doesn’t match the average computed in the software – I think the points acquired and the measurement points must not match) and “Max Power (dBm)” is the peak value found in the graph array data. 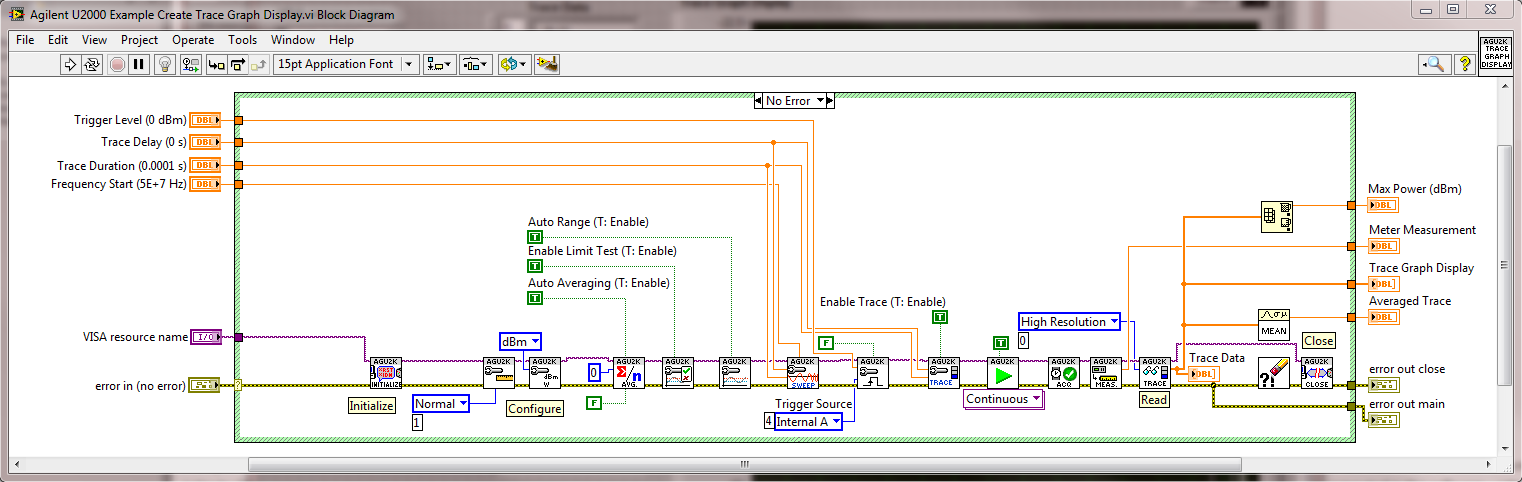 Figure 3. Block Diagram of Example Create Trace Graph Display VI. Figure 3 shows the block diagram of the example LabVIEW code. This code has quite a bit more configuration than the example code from the programming guide in Figure 1. Figure 1 shows the critical command and many of the extra commands I have in the LabVIEW code can be stripped out as they are just resetting the default values – I just felt this was more complete. As I mentioned earlier, one nice thing in this code is the U2000 driver implements the code to read the trace data. This capability is in the VIs “Read Trace.vi” and “Parse Data.vi” which are shown in Figures 4 and 5. You can also see that the driver has a comment with some details about the IEEE 488.2 data format. 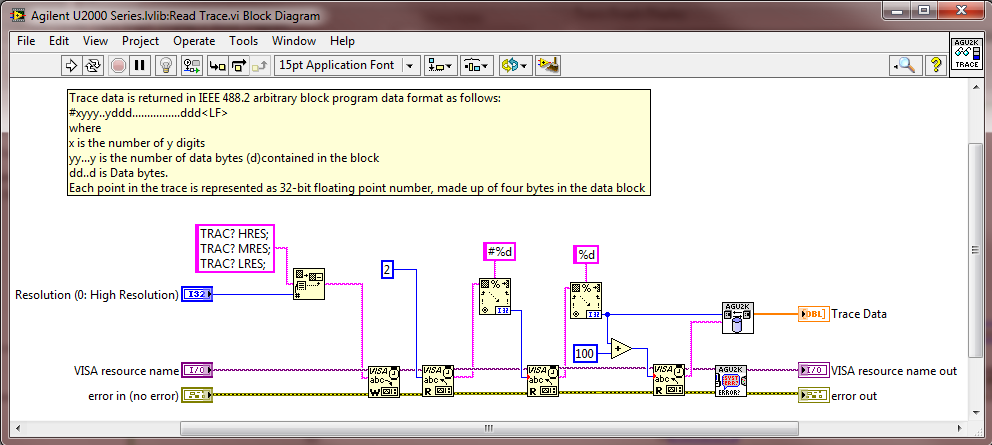 Figure 4. Read Trace.vi. 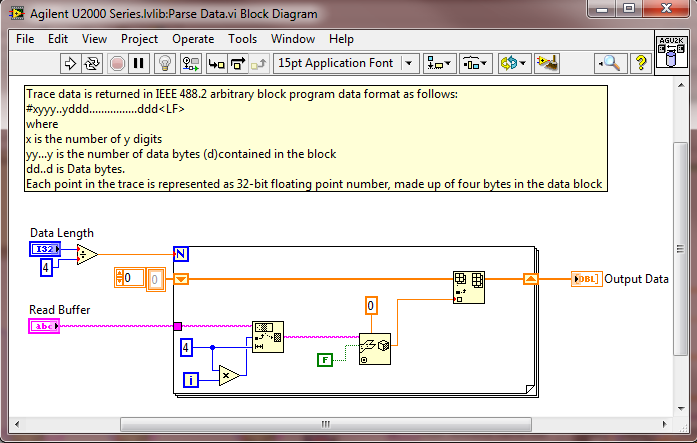 Figure 5. Parse Data.vi. One strange thing I found with this code is it seemed to work great if I kept the sub-VI “Wait for Acquisition Complete.vi” open, but if it was closed it seemed like code would hang-up a lot. Not sure what that is all about.
I posted this example code and you can download on this page, it is LabVIEW 2012. Note that I’m not providing the U2000 driver, get that from NI at the link above. Summary This post shows how to implement an Agilent U2001A power sensor trace graph display in LabVIEW. I feel this code provides a slightly more complete solution than the example code provided in the Agilent Programming Guide. Another useful feature of this code is it makes it possible to find the peak power of a measurement using the average power model power sensor.
0 Comments
|
Archives
December 2022
Categories
All

|
 RSS Feed