|
I have previously written about debugging, but that was more of a high-level abstract view. I think this is really important topic for test engineers and engineers in general. I am often disappointed in my own debugging skills, but also I have met very few people who are very good at it either. A tool I’ve been trying to use a lot for debugging lately is the Microsoft program OneNote. OneNote is great and I try to use it to write everything down. This post is a recent example of how I use OneNote to aid in my debugging. To set things up, I was having a problem with a test system I've been developing where measurements (in this case an RF power measurement taken with a USB power sensor) seemed to be working well in the short term and drifting in the long term. The first thing I did was to take a few repeated measurements and try to get a feel for this problem. It seems to me that the first part of debugging a problem is just sort-of playing around for a while to start to get a sense of it. The trouble with this is it’s easy to get stuck in this mode. This is where forcing myself to write things down in OneNote helps. It speeds up the transition from just playing around to drawing conclusions and start logically narrowing down the problem to the root-cause. 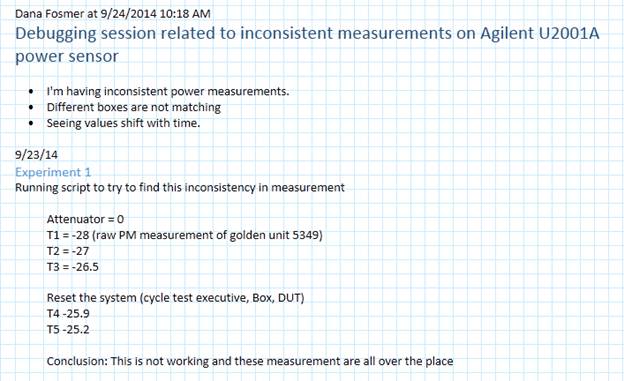 Figure 1. First segment of debugging session in OneNote. Looking at Figure 1, you can see that first thing I always do before I write something in OneNote is to right click and select the last option in the menu which is to insert your name, date and time. Next, I put some kind of title using the heading 1 style and write a few bullet points about what I’m doing. Using the heading 2 style, I break the notes up further into separate little experiments. I don’t really have anything that defines an experiment, it just sort-of breaks up the notes into how the thought process goes. I then start taking some measurements and recording the results. I’m not that careful about recording all details of the experiment, like the equipment I used and while that would be a good addition, I just use the notes to aid in my thinking through the problem. As you can see, the measurements start at -28 dBm and rise to -25.2 dBm. I would expect them to stay within about 0.1 dBm. A couple more notes, when I refer to “box” that is basically the test system and “golden unit 5349” is a known good and characterized DUT that I can trust. At the end you can see I wrote a little conclusion for myself that basically just says, this isn’t doing what I would expect I have to keep debugging. What’s important about writing a conclusion here is that it forces me to stop and think of how to isolate what is going on. I could easily continue making this measurement all day and not learn anything more. This is what I was talking earlier, about getting a feel for the problem. You have to start somewhere but also focus on how to quickly move past this stage. 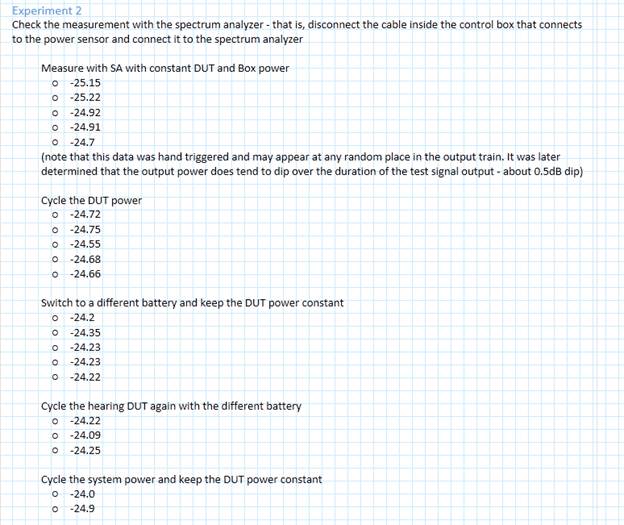 Figure 2. Experiment 2 attempts to isolate the problem to a specific part of the test system. Continuing on, Figure 2 shows the different configurations I went through to try to recreate the variation. You can see I tried cycling the DUT power (the DUT is battery powered and the battery voltage can have an effect on the output power) and different batteries. If you look carefully at some of the text you'll notice it was not written at the same time the measurements were taken. I went back at a later time to add this text as I learned more about how to properly setup and measure with the spectrum analyzer. As you can see, the measurements with the spectrum analyzer were pretty consistent. 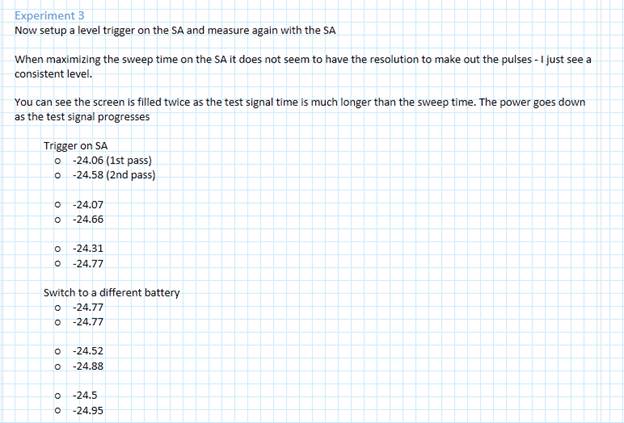 Figure 3. Spectrum analyzer measurements after improving how the measurements were taken. In Figure 3 I’m still making the same measurement with the spectrum analyzer, but now I’ve setup a trigger so those measurements should be more repeatable and comparable. 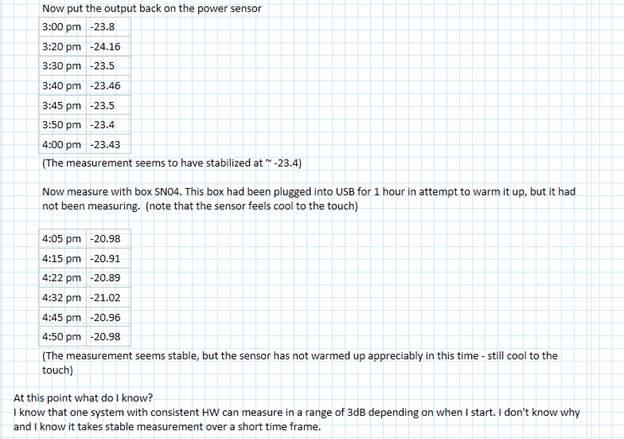 Figure 4. Continuation of Experiment 3, drawing conclusions about this measurement. Figure 4 shows more of the section labeled “Experiment 3.” I’ve now switched back to the power sensor and am spacing out the measurements over a longer time and recording when they were taken. At this point, I was thinking that the length of time the system sits idle had some effect on the measurement and usually if a measurement changes over time it’s due to some sort of environmental factor. I just know this from experience and that’s why I’ve also started noting the general temperature of the power sensor. I know these power sensors can get quite warm. Towards the end, I added measurements from a second test system to look for variation due to cold versus warmed-up power sensors. 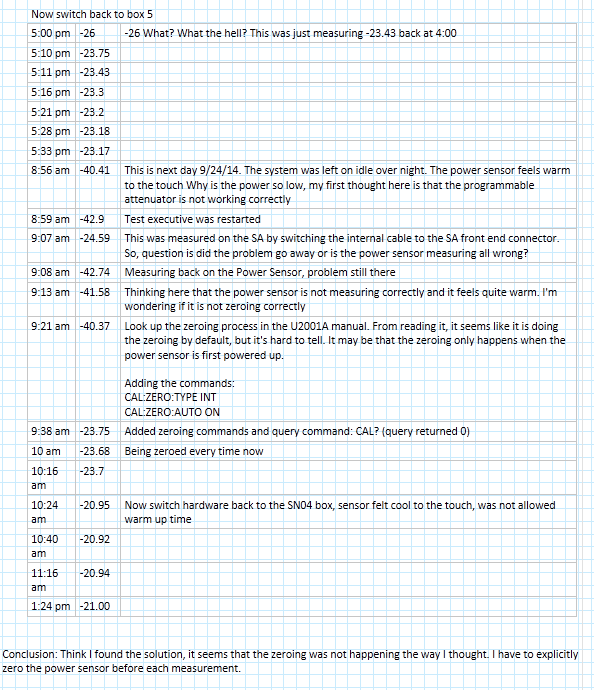 Figure 5. Last portion of Experiment 3 and the OneNote debugging session of the inconsistent power measurement. Figure 5 is the last of the measurements, you can see that I continue to track the time of each measurement and there are two big surprises related to the measurement. The first surprise is the first line, the measurement is now 2.57 dBm lower on the same setup than it was just an hour ago. The second big surprise is the power drops a ridiculous 17.24 dBm after the system is left powered overnight.
The big breakthrough was when the power sensor was consistently measuring down at -40 and the spectrum analyzer was still measuring up at -24. This told me that the power sensor was the problem and it was what was causing the measurement variation. This made me feel pretty stupid, as I had been working with this power sensor for a while and its measurements were apparently useless (but I was making progress). At this point I had identified a problem and need to find a way to fix it. I did know that power sensors need to be zeroed before taking measurements, but I had thought I had read in the instrument manual that this was done automatically when the sensor was powered up or the temperature changed by 5 degrees. I decide I could verify the zeroing had been done by explicitly adding the commands to zero it before each measurement. Well as you can see in Figure 5, the measurement snapped right back into line with the spectrum analyzer once the zeroing had been done. I then wrote my final conclusion that this was a big source of the variation in question and the power sensor should be zeroed before every measurement. My conclusion was temperature change was the source of variation and it was not being accounted for. Summary In this article I went through my process for debugging a real problem I had and showed how writing aided in that debugging. I’m not so much trying to show what a genius debugger I am, but that my debugging gets way better if I force myself to write things down as I go. I think Microsoft OneNote is a great tool for this purpose.
0 Comments
|
Archives
December 2022
Categories
All

|
 RSS Feed