|
Recently I’ve been developing a PXIe 1065 chassis based test system using Labview. The chassis includes an 8150 controller, a matrix card, a DMM, a DAQ and some power supplies. It’s a fairly simple set of instruments, but capable of many types of measurements. National Instruments supplies drivers to operate these cards but they require some effort to learn how to put them all together and create working test applications. I’d like to show some examples of how to make some basic measurements and some methods I feel are useful to improve on the supplied drivers. Note that this isn’t the real code I’m writing for my employer since I don’t want to give away any secrets or anything, but it is real working code. Initialization Before any of the instruments can be used to make measurements they all have to have instrument handles established. A good way to do this is by having a test application run an initialize routine that will create instrument handles for all of the instruments and hold them in a global variable. Figure 1 shows the block diagram to initialize the instrument handles for the Matrix, DMM and Power Supply and stores them in a global to be utilized by the application code later. The DAQ is not included, as it doesn’t require a handle to be initialized. The DAQ driver is a little different than the others; I’ll address this later. Figure 2 shows the global variable used to store these handles.  Figure 1. Initialize instrument handles for PXI instruments. 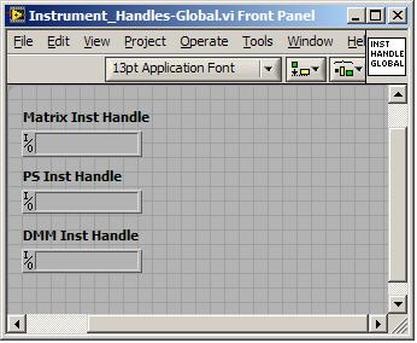 Figure 2. Global variable holding instrument handles (shown un-initalized) Matrix The matrix card is used for switching the instruments to the DUT. I’ve been working with a PXI-2532 16 by 32 crosspoint matrix. Additional hardware has been added as an ITA to make hard connections from the matrix inputs to the other instruments in the chassis as well as the DUT. That is, before you can use the matrix you have to wire the other instruments to the matrix inputs and wire the outputs to your test fixture and ultimately, DUT. Here is where the instruments are connected to the inputs of my system (omitting a couple I’m not discussing) 0. NA 1. NA 2. DMM V+ 3. DMM – 4. DAQ Counter Source 5. NA 6. NA 7. DAQ Analog Out Ch 2 8. DAQ Analog Out Ch 1 9. DAQ Analog Out Ch 0 10. Power Supply Out 2 +20V 11. Power Supply Out 1 +6V 12. Power Supply and DAQ Ground 13. Power Supply Out 3 -20V 14. DAQ Analog In Ch 0 15. DAQ Analog In Ch 8 The two essential Matrix drivers supplied by NI are Connect and Disconnect VIs, as shown in Figure 3. 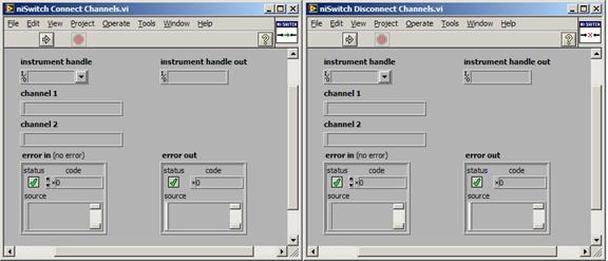 Figure 3. Connect and Disconnect driver front panels. Both VIs simply take the channel 1 input as the matrix input and the channel 2 input as the matrix output you want to connect or disconnect. For the 2532 matrix the input channels are R0…R15 and the output channels are C0…C31. Figure 4 shows and example of connecting the DMM at inputs 2 and 3 to outputs 1 and 2. Let’s say there is a 1k resistor at outputs 1 and 2. 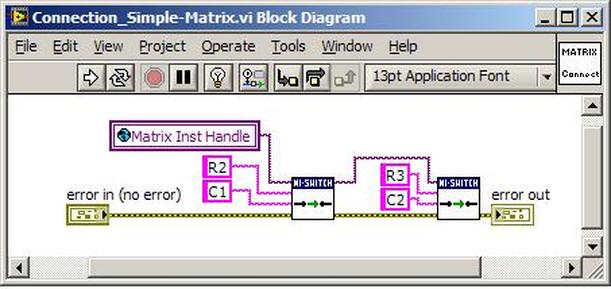 Figure 4. A simple matrix connection The code in Figure 4 will work but it’s not very flexible and it is pretty cryptic as to what is being connected. Some comments could be added to the code to say that the DMM is connected to a 1k resistor. But, a better way would be to create a new driver and give all the inputs and outputs meaningful names using some enumerated types. With a little more work a much more flexible Matrix control can be developed. Then new driver is called, Settings_Advanced-Matrix.vi. Unlike the simple code in Figure 4, it contains three modes: Set List, Clear List and Clear All. It also provides the ability to set multiple input to output pairs at once by accepting an array as input. The input and output designations have been given unique names as controlled by some strict type def controls. The advantage of the strict type defs is that the matrix input and output designations can be updated in one place and all instances of the control elsewhere will update as well. Finally, the code allows for relay debounce by calling the NI driver, “niSwitch Wait For Debounce.vi.” Figure 5, 6 and 7 show the block diagram of Settings_Advanced-Matrix.vi in the three modes. 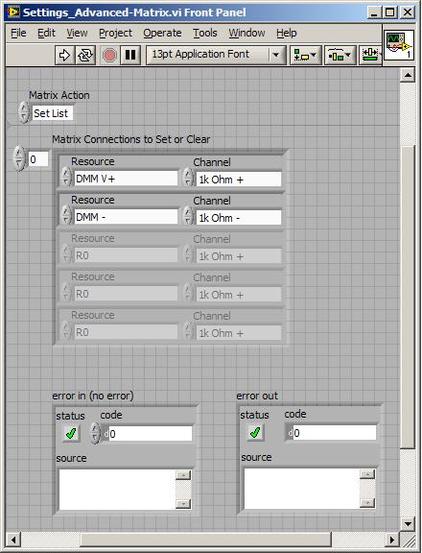 Figure 5. Front panel of Settings_Advanced-Matrix.vi 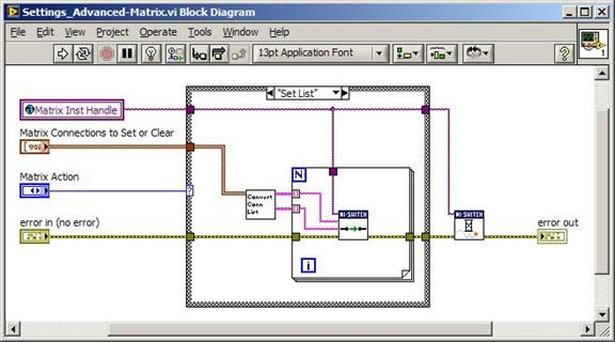 Figure 6. “Set List” mode of Settings_Advanced-Matrix.vi 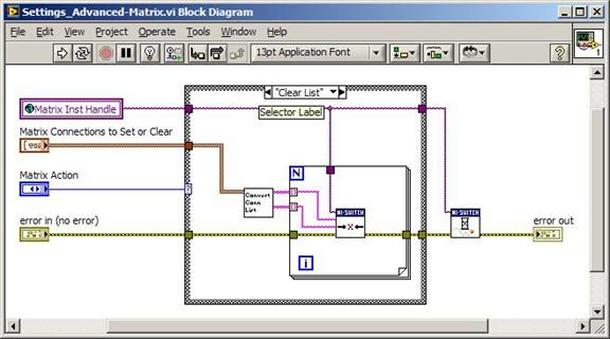 Figure 7. “Clear List” mode of Settings_Advanced-Matrix.vi 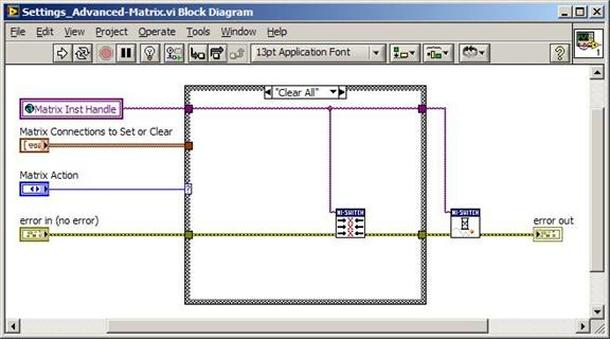 Figure 8. “Clear All” mode of Settings_Advanced-Matrix.vi In Figure 5 you can see the “Matrix Action” enumerated type control that allows the selection of “Set List”, “Clear List” or “Clear All.” It also shows that the VI has the ability to set multiple input to output connections at once and that the inputs and outputs have been assigned meaningful names. Figure 9 and 10 show the strict type defs used for the input and output names. Figure 6 and 7 show the use of a subVI called Convert_Connection_List-Matrix.vi. This VI is shown in Figure 11. 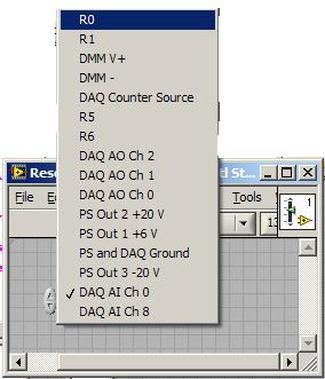 Figure 9. Resource (inputs) control strict type def  Figure 10. Channel (outputs) control strict type def 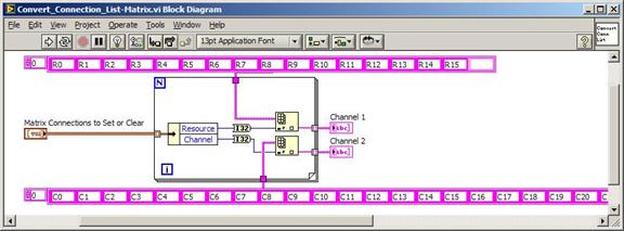 Figure 11. Convert Connection List block diagram Figure 11 shows how the array of meaningful resource and channel names are processed and replaced with the R0… C0… names that the NI driver uses. An additional enhancement that might be considered is if a certain combination of connections could cause damage to the instruments, error checking to prevent those combinations could be added. DMM Now that there is some code in place for making matrix connections we start using some of the other instruments present in the system. The DMM in the system is an NI PXI-4071. For the case of the DMM the drivers supplied from NI are pretty good, they could be wrapped but for my purposes here they will do. Figure 12 shows the block diagram of how to measure the 1k ohm resistor that is at outputs 1 and 2 of the Matrix. 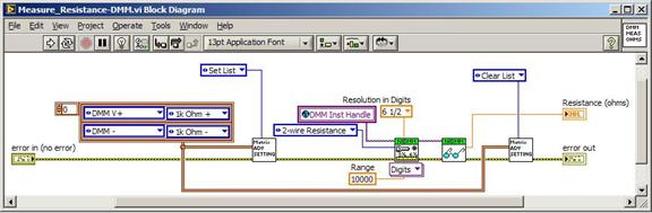 Figure 12. Measure resistance with a DMM through the Matrix. We can see in Figure 12 that the VI, Settings_Advanced-Matrix.vi developed in the last section is used to connect the DMM to the 1k ohm resistor through the matrix. The resistance is measured using the NI drivers niDMM Configure and niDMM Read. Finally, the matrix settings are cleared upon exiting the VI. A good way to ensure you have cleared the same relays you set is to wire the same constant to the set and clear matrix drivers. Figure 13 shows the front panel of the resistance measurement, showing that the VI read 1k ohms (note this is a 5% resistor and that is why it’s off from 1k) 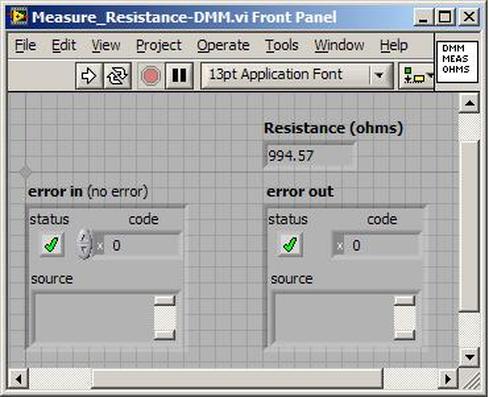 Figure 13. Measure Resistance Example. Now, let’s work in the power supply and use the DMM to measure voltage and current. Figure 14 shows an example of how to use the power supply to force current through the 1k ohm resistor and measure the resulting voltage across the resistor. 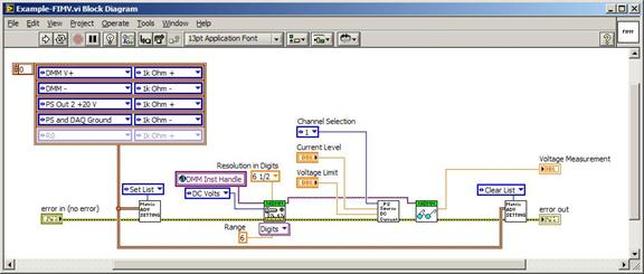 Figure 14. FIMV using the power supply and DMM. Following the code in Figure 14 we see that the matrix is setup to connect the power supply and the DMM to the 1k ohm resistor. The function, resolution and range of the DMM are configured followed by the power supply being set to source the current. Finally, the voltage measurement is taken with the DMM and the matrix settings are cleared before exiting. Figure 15 shows the front panel of the FIMV example. 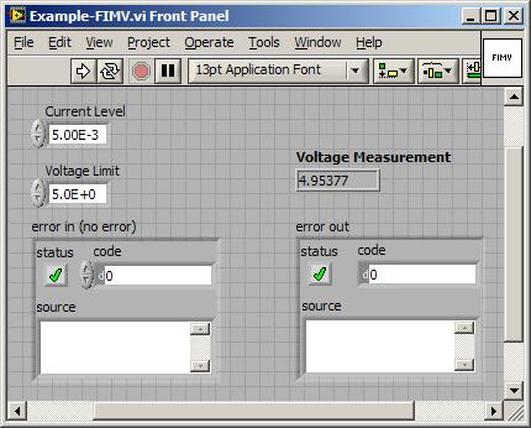 Figure 15. FIMV Example front panel. From Figure 15 we can see that when forcing 5mA through a 1k ohm resistor the result is roughly 5V. Figure 16 shows the code to force voltage and measure current. 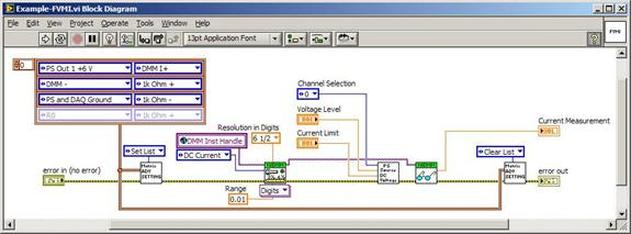 Figure 16 FVMI Example block diagram. In Figure 16 we can see that the matrix settings now apply the power supply to the 1k ohm resistor with the DMM connected in series with the positive power supply lead in order to measure current. The DMM is configured for range, function and resolution, the power supply is configured to force voltage and set the current limit, the current is measured by the DMM and the matrix settings are cleared. Figure 17 shows the front panel of the FVMI example. 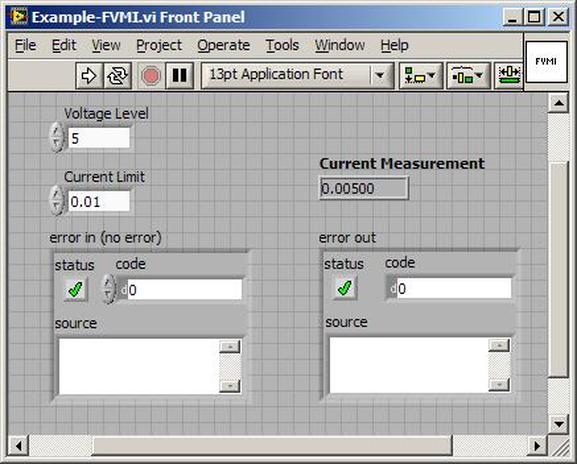 Figure 17. FVMI example front panel. From Figure 17 we see that when 5V is applied to the 1k ohm resistor with a current limit of 10mA, the result is 5mA. Figure 14 and 16 show that I didn’t really develop drivers for the DMM to configure them to measure DC voltage or current, I just use the NI supplied drivers. However, for the application of digitizing a waveform a driver is worthwhile to develop. Two VIs were developed to configure and perform a digitization, Figure 18 shows the block diagram of the digitize configure. 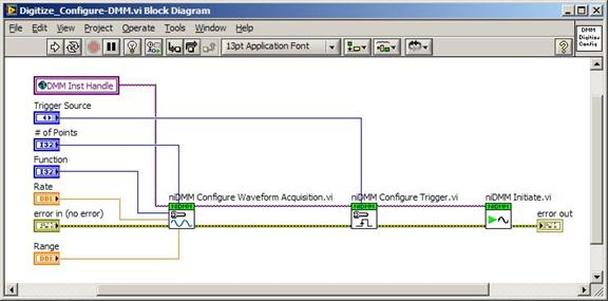 Figure 18. Digitize configure DMM driver. In Figure 18 we can see that there are three NI drivers used. The first is the configure waveform acquisition, this configures the DMM to digitize. Configure trigger, sets the trigger source to various trigger sources like, immediate or external. Finally, the initiate VI tells the DMM to arm and wait for the trigger. Figure 19 shows the front panel of the digitize configure DMM driver. 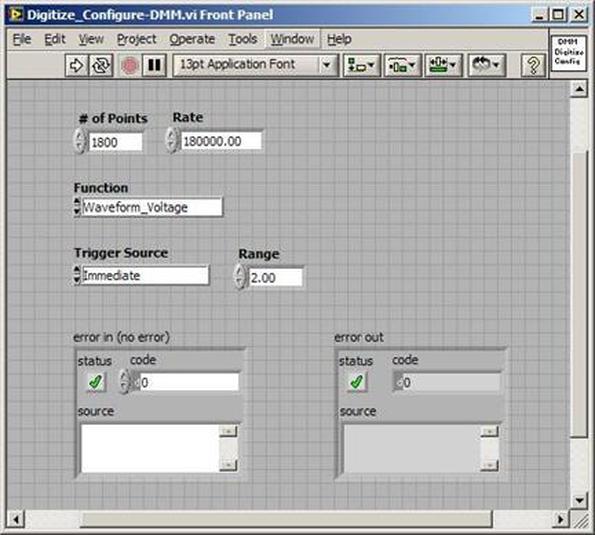 Figure 19. Digitize configure DMM driver. Figure 19 shows all the options that can be set for configuring the DMM to digitize. Most of the options are obvious, the rate is the number of sample per second. The range is the measurement range in the units that match the measurement function. Figure 20 shows the diagram of the digitize VI. 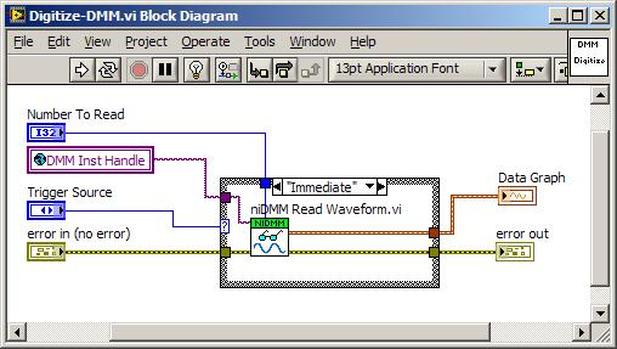 Figure 20. Digitize VI Block Diagram. Figure 20 shows the code that will send the instrument a trigger based on the trigger source and perform the digitization. Figure 21 shows the front panel of the digitize VI with a digitized sine wave being displayed. 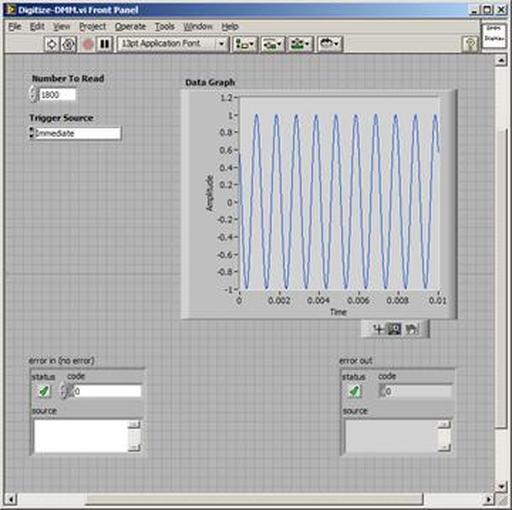 Figure 21. Digitize front panel. Figure 22 and 23 show an example of how to use the digitize drivers with some of the other code that has already been developed to digitize a sine wave. 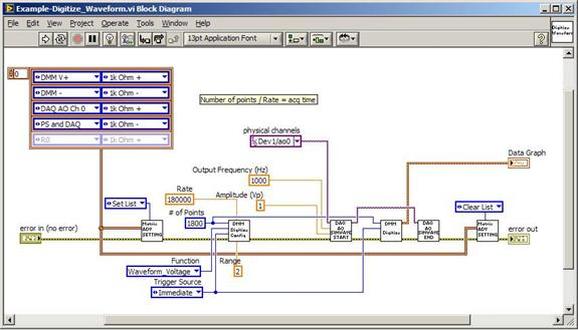 Figure 22. Digitize sine wave example block diagram. 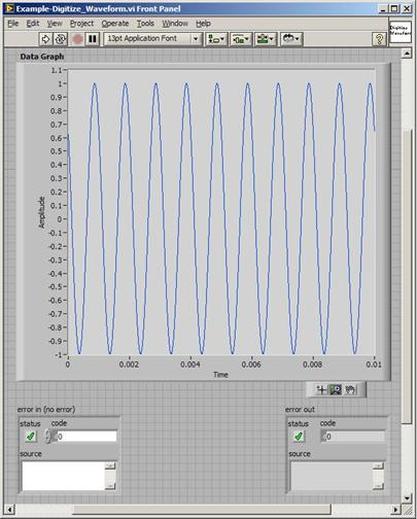 Figure 23. Digitize sine wave example VI front panel. Figure 22 shows the following operations to generate and digitize a sine wave. The first step is to connect the DMM and the DAQ analog output across the 1k ohm resistor. Next, the DMM is configured to digitize for 10ms and the DAQ starts to output a sine wave at 1kHz. Finally, the waveform is digitized, the sine wave output is stopped and the matrix settings are removed. We can see in Figure 23 that since a 1kHz sine wave has a period of 1ms and 10ms were digitized there are ten cycles digitized. Power Supplies While we used the power supply drivers in the FVMI and FIMV code in the DMM section to force the voltage and current we did not look at that code. The system contains the NI PXI-4110 power supply. Figure 24 shows block diagram for the Source DC voltage VI. 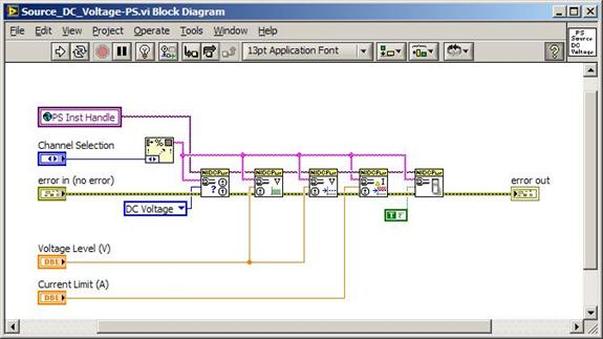 Figure 24 Force DC Voltage block diagram. Figure 24 shows all the NI drivers used to configure and output DC voltage with the power supply. First the power supply function is selected, followed by setting the voltage level and range (the range is automatically set to a predefined level based on the desired voltage level). The current limit is then set and the output enabled. Figure 25 shows the force DC current block diagram. 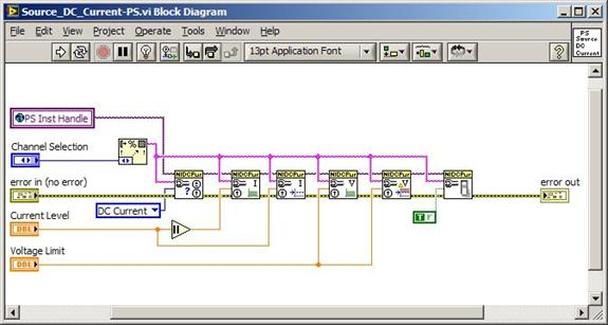 Figure 25. Force DC Current Block Diagram. Figure 25 shows a similar procedure as to set DC voltage. Set the function, set the level and range, set the voltage limit and enable the output. DAQ Again, in the DMM section the DAQ was used to generate a sine wave to digitize but this code was not examined. The system contains a 6259mx m series DAQ. Figure 26 and 27 show the DAQ drivers used to start and stop generating a sine wave. 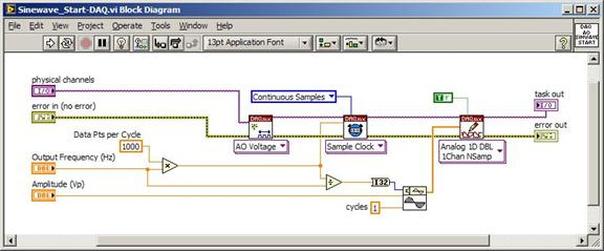 Figure 26. Sinewave Start DAQ VI. Figure 26 shows that it takes three steps to configure a DAQ analog output. First, a physical analog output channel must be selected and configured to output voltage. Next, the sample clock is configured to output data-points at the desired rate. Finally, a sine wave pattern is generated in software and programmed to the DAQ to be output at the previously programmed clock rate. This VI will begin outputting the waveform continuously as the sample clock was programmed to continuous samples. Figure 27 shows the sine wave stop VI. 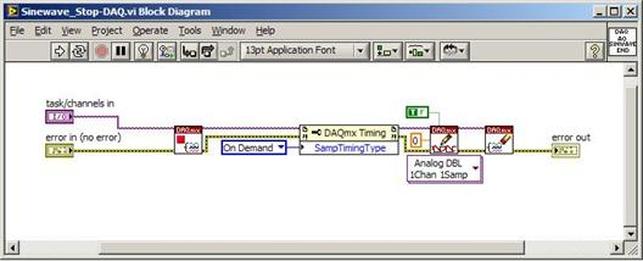 Figure 27. Sinewave Stop VI block diagram. The steps to stop the DAQ output shown in Figure 27 are to stop the task, write a zero to the analog output voltage and clear the task. Figure 28 shows the block diagram of an example of how to use the DAQ to digitize a waveform. 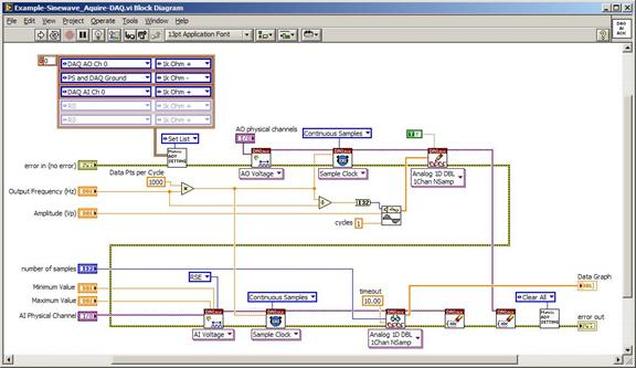 Figure 28. Example of waveform generation and digitization with the DAQ. In Figure 28 we can see that the matrix is used to connect a DAQ analog input to analog output through the 1k ohm resistor. The code to generate the sine wave is the same as from the DMM digitization example. The new code is used to digitize on the analog input and is very similar to the code used to generate the waveform. Replace the analog output channel with an analog input channel. Replace the write channel VI with the read channel VI. Finally, clear both tasks and remove the matrix settings. Figure 29 shows the front panel of the code in Figure 28. 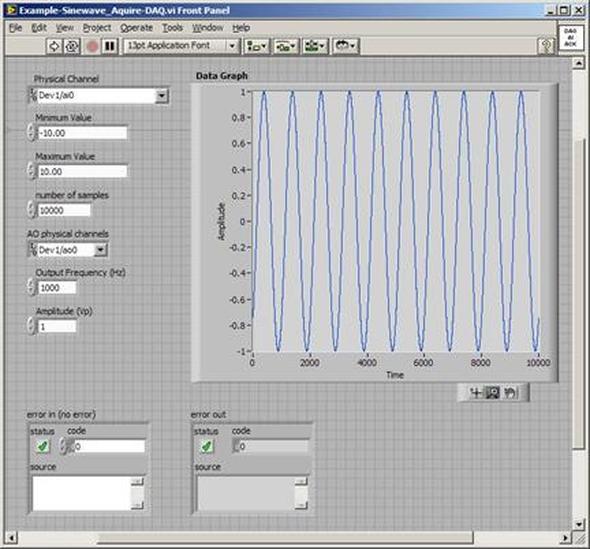 Figure 29. Front panel of digitize waveform with DAQ example
Summary PXI has become the standard for rapid development of flexible, low cost automated test systems. National Instruments with its Labview development environment is the industry heavyweight behind PXI based test. NI provides drivers for their PXI card instruments, however, these drivers can take time to learn and can often require additional work to make them robust instrument drivers. In this entry we saw some examples of how to build these drivers and how to use them to create some useful instrument functions. Some examples included, outputting voltages and currents, connecting instruments via a matrix card, generating waveforms and digitizing waveforms. |
Archives
December 2022
Categories
All

|
 RSS Feed