|
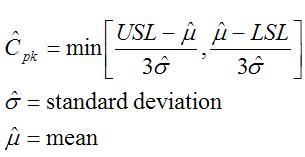
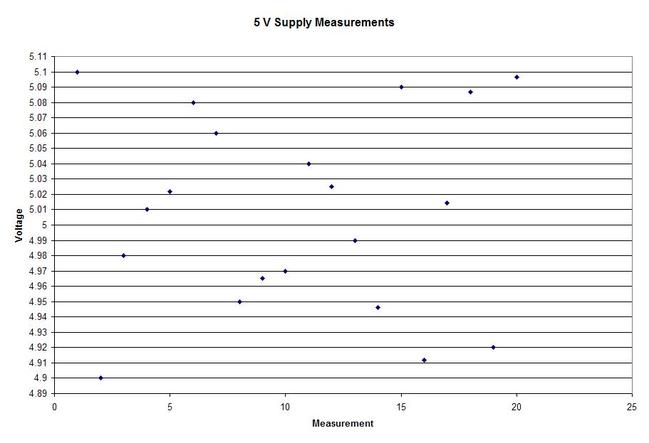
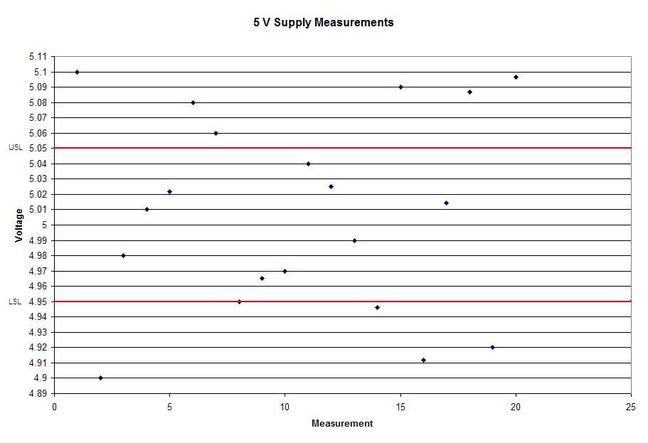
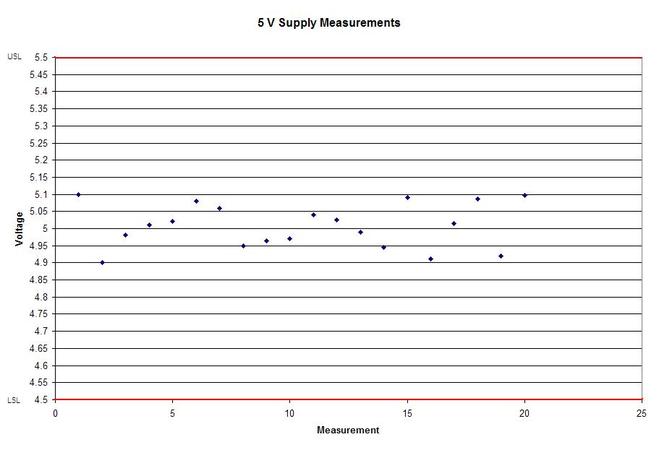
A statistical concept that comes up often for me as a test engineer is the process capability index. This is a statistical concept that comes from statistical process control and is used on a process that is in control. I don’t really do anything with process control or control charts, but the process capability index is still a useful tool when you are developing tests and need to quickly evaluating a measurement and the feasibility of test limits being applied to it. Cpk When applying test limits to a measurement a design engineer (or someone with more knowledge of the circuit in question) may have an idea of what those limits should be, or they may just be offering a suggestion, making an approximate estimate. In this case, it may be wise to establish a temporary limit to be evaluated when more measurement data is available. Once a good sampling of the measurement data is available the limits can be evaluated to determine if they are going to be capable or if the measurement population is going to be coming very close to the specification limit when the measurement is taken a higher volume in production. Using the process capability index gives a hard number to tell you if you are right up against the specification limit and are going to risk a big fall out if the process shifts. One such process capability index is the Cpk statistic. Here is the formula for Cpk. The little hats just mean that these are estimates. Figure 1 shows a plot of 20 measurements of a 5 V power supply (I just made these numbers up for illustration) Figure 1. Measurement of a 5 V power supply repeated 20 times. Let’s say that we are measuring a 5 V power supply with an upper and lower specification limit (USL, LSL) set at 1%, 5.05 and 4.95 V. Figure 2 shows these limits marked on the plot. There is obviously some problem here as there are several failures. Calculating Cpk is not really necessary in this case but the result would be: This is a bad result, any Cpk less than 1 is not good and ideally you want it to be over 2. Figure 2. Measurement of 5 V power supply with 1% specification limits. Let’s try 10% limits of 4.5 and 5.5 V as shown in Figure 3. Now we get: Cpk of 2.545 indicates that the limits are very good and the measurement population is not going to be close to either the low or high limit and is not close to having a lot of failures should the population shift. Figure 3. Measurement of 5 V power supply with 10% specification limits.
Now obviously Cpk is not the only factor in setting limits. You don’t just expand the limits if the Cpk is less than 2. The limits would ideally be calculated based on the component tolerances and using a monte carlo type analysis. However, the Cpk is useful in evaluating if a measurement is accurate and if it can be expected to have failures when under higher volume manufacturing. Summary The process capability index is a statistical concept taken from process control that is useful for test engineers to evaluate limits and measurement performance. Cpk is one method of calculating the process capability index. Cpk will help to evaluate how close a measurement population is to either the lower or upper limit. This is useful in predicting future test failures and determining if the measurement accuracy can or should be improved.
0 Comments
Your comment will be posted after it is approved.
Leave a Reply. |
Archives
December 2022
Categories
All
|


 RSS Feed
